Aggregating basic statistics
This tutorial can be run as a Jupyter notebook from the 5s-TES notebooks repository
The outputs from TES tasks can be easily used to calculate basic statistics.
This example will use summary statistics from a dataset in the OMOP common data model. There is a container which, given a SQL query that filters an OMOP table by your criteria, will calculate the necessary summary statistics for your final analysis.
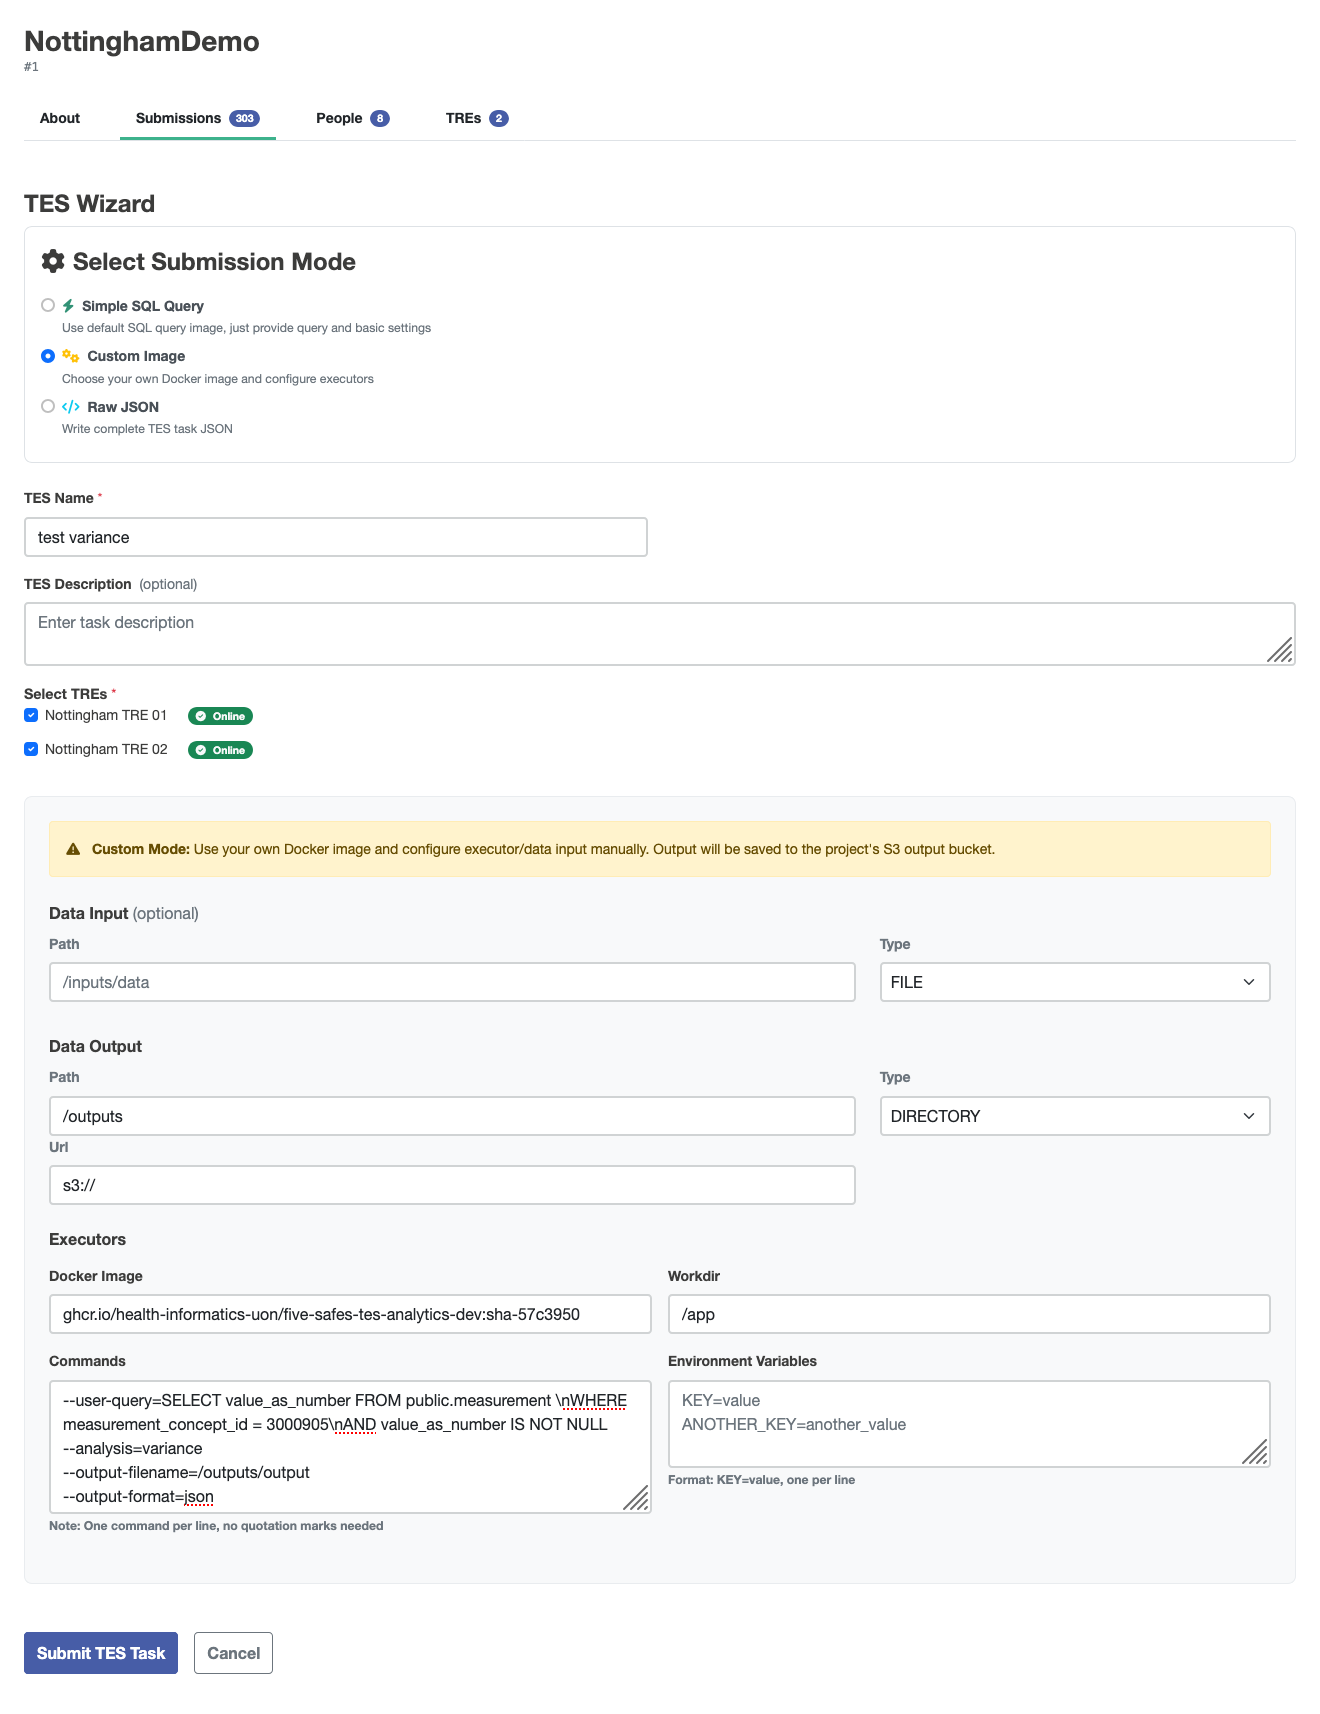
This example data was collected using the Custom Image wizard in the submission layer with these settings changed from default:
| Field | value |
|---|---|
| image | ghcr.io/health-informatics-uon/five-safes-tes-analytics-dev:sha-57c3950 |
| workdir | /app |
| command | --user-query=SELECT value_as_number FROM public.measurement \nWHERE measurement_concept_id = 3000905\nAND value_as_number IS NOT NULL --analysis=variance --output-filename=/outputs/output --output-format=json |
Expand to view generated JSON
    {
         \"id\": \"450\",
         \"state\": 0,
         \"name\": \"test variance\",
         \"description\": \"Federated analysis task\",
         \"inputs\": null,
         \"outputs\": [
                  {
                           \"name\": \"Query Results\",
                           \"description\": \"Results from the requested query execution\",
                           \"url\": \"s3://\",
                           \"path\": \"/outputs\",
                           \"type\": \"DIRECTORY\"
                  }
         ],
         \"resources\": null,
         \"executors\": [
                  {
                           \"image\": \"ghcr.io/health-informatics-uon/five-safes-tes-analytics-dev:sha-57c3950\",
                           \"command\": [
                                    \"--user-query=SELECT value_as_number FROM public.measurement \\nWHERE measurement_concept_id = 3000905\\nAND value_as_number IS NOT NULL\",
                                    \"--analysis=variance\",
                                    \"--output-filename=/outputs/output\",
                                    \"--output-format=json\"
                           ],
                           \"workdir\": \"/app\",
                           \"stdin\": null,
                           \"stdout\": null,
                           \"stderr\": null,
                           \"env\": {}
                  }
         ],
         \"volumes\": null,
         \"tags\": {
                  \"Project\": \"NottinghamDemo\",
                  \"tres\": \"Nottingham TRE 01|Nottingham TRE 02\"
         },
         \"logs\": null,
         \"creation_time\": null
    }
The aggregate_utils module provided with this notebook allows you to calculate statistics for the overall population by aggregating intermediate result
from pathlib import Path
from aggregate_utils import VarianceIntermediate, TTestIntermediate, make_variance_intermediate_from_json, aggregate_variance_intermediates
import numpy as np
The example data are held in ./data
paths = {
    "tre1": "./data/variance-tre-1.json",
    "tre2": "./data/variance-tre-2.json"
}
The make_variance_intermediate_from_json function reads the data from the JSON file and provides methods for aggregation.
The returned values hold the count (n), the sum (total), and the sum of squares (sum_x2) for the value read from the original table.
These three pieces of information are sufficient to calculate several other summary statistics.
variance_intermediates = {
    k:make_variance_intermediate_from_json(Path(v))
    for k,v in paths.items()
}
variance_intermediates
'tre1': VarianceIntermediate(n=2140, total=10819.0, sum_x2=76707.0),
'tre2': VarianceIntermediate(n=4571, total=228747.0, sum_x2=15257585.0)
For example, the aggregate_variance_intermediates function will aggregate these as if they came from a single sample.
aggregated_intermediate = aggregate_variance_intermediates(variance_intermediates.values())
aggregated_intermediate
VarianceIntermediate(n=6711, total=239566.0, sum_x2=15334292.0)
The mean and variance properties are for the whole sample.
aggregated_intermediate.mean
35.69751154820444
aggregated_intermediate.variance
1010.6365591480935
The values are from a very skewed distribution. To demonstrate how the same information can be used to conduct other common statistical analyses, random samples from a normal distribution can be generated with this code:
mu, sigma = 50, 10
rng = np.random.default_rng()
s = rng.normal(mu, sigma, 10)
A TTestIntermediate uses the same three pieces of information as a VarianceIntermediate.
gaussian_t_test_intermediate = TTestIntermediate(
    n=len(s),
    total=np.sum(s),
    sum_x2=np.sum(s**2)
)

gaussian_t_test_intermediate
TTestIntermediate(n=10, total=np.float64(476.9742997017046), sum_x2=np.float64(23459.825051161773))
You can also use this information to perform a one-sample t-test.
gaussian_t_test_intermediate.one_sample_t_test(52)
0.07033644170438572
There are many other analyses that can be performed with a few building blocks like this.